Most day traders pick candlestick charts because they cram a lot of information into a tiny space. A candle tells you where the price opened, where it travelled, and how the battle ended. You start seeing patterns once you’ve looked at enough of them. Some candles feel strong and decisive. Others show hesitation or a quick reversal.
Every platform displays charts a little differently, but they all show the same thing at their core: the back and forth between buyers and sellers. If you happen to trade other instruments as well, knowing the basics of what is CFD trading can help you recognise similar behaviour across markets.
The key is not memorising dozens of patterns. It is about getting comfortable reading what the chart is showing you right now.
Trend direction is often easier to see than people expect. You’re basically asking a simple question: is the stock mostly moving up, mostly moving down, or not really going anywhere at all?
A few things help that stand out visually:
Traders generally prefer going with the trend instead of against it. It just makes life easier. Fighting the obvious movement tends to create more stress than results.
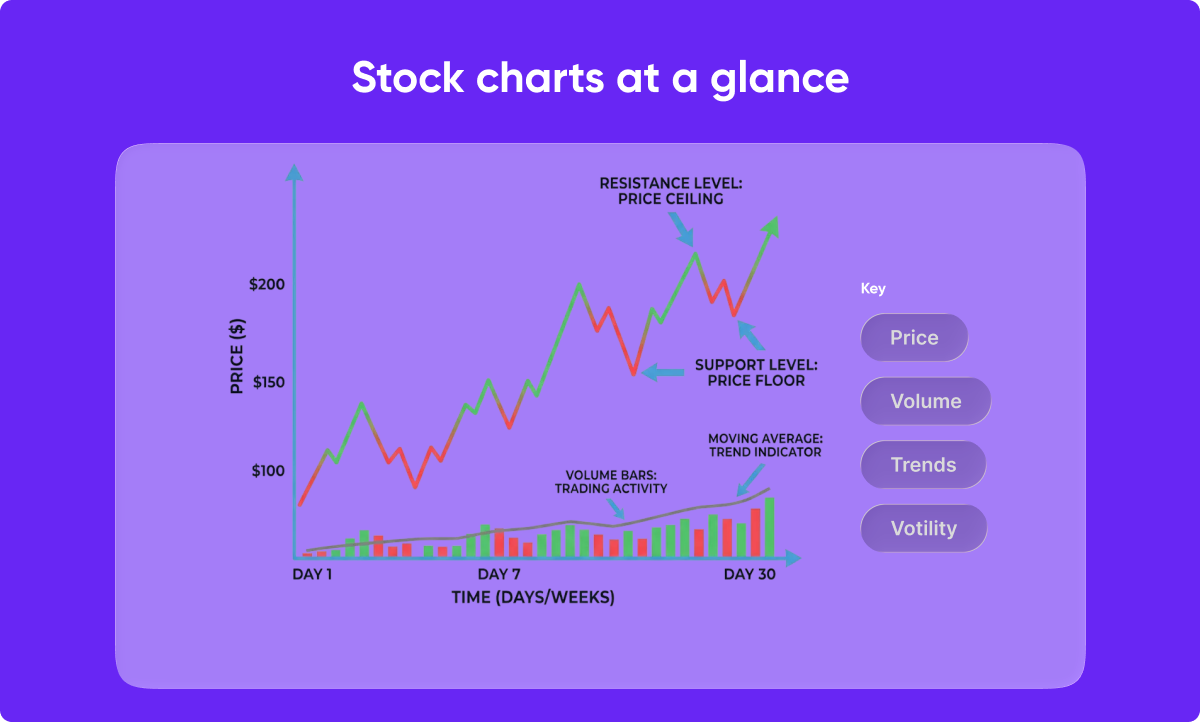
Support and resistance zones are places where price reacted in the past. They’re not perfect lines drawn with a ruler. They’re closer to “areas where traders paid attention before”. When you scroll back on a chart, you’ll see moments where price stalled, turned quickly, or pushed through with effort. Those areas matter because markets remember them more often than you’d think.
Here are a few signs you might notice:
Repeated reactions
If price keeps pausing in the same zone, mark it.
Sharp flips
Sudden direction changes usually mean that traders acted fast.
Breaks with strength
When price forces its way through a familiar area, momentum is probably shifting.
These zones help you build a rough map for the day. They’re useful for planning where you might enter or where you should avoid taking unnecessary risks.
They use candlesticks, trends, support and resistance zones, and volume to understand how the price is behaving. These elements help them make decisions during fast market movement.
It is a guideline some traders use to limit losses. If a trade falls roughly 7 per cent against them, they exit to protect their account. The exact number varies between traders.
It is an informal timing idea. Some traders avoid the first few minutes after the open, look for clarity after a short pause, and allow their trades enough time to develop if momentum is strong.
The most common reasons are poor risk control, reacting emotionally, or trading without a clear plan. Structure and routine help reduce these problems.